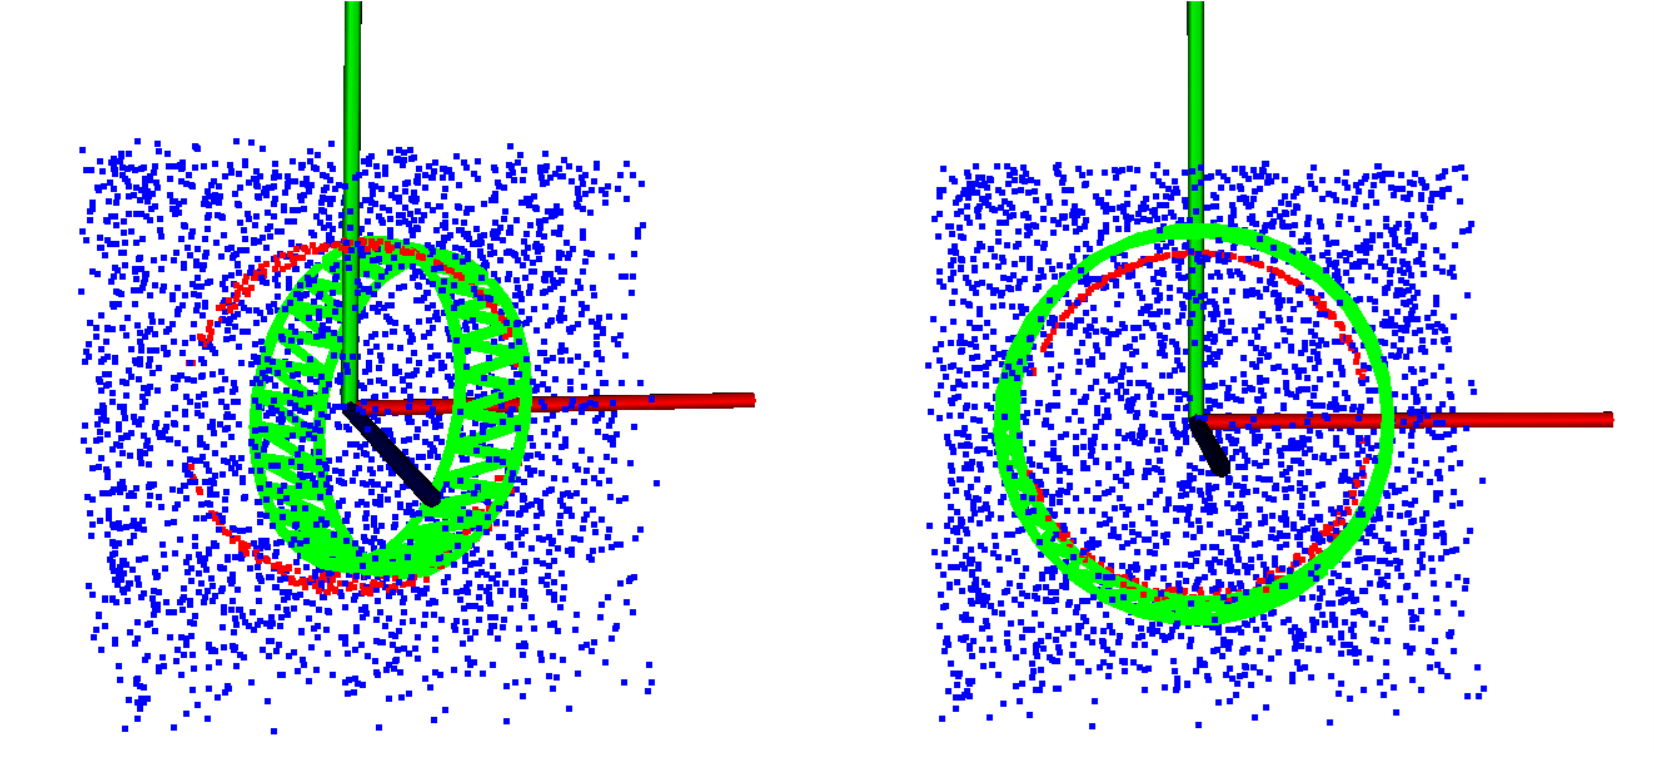
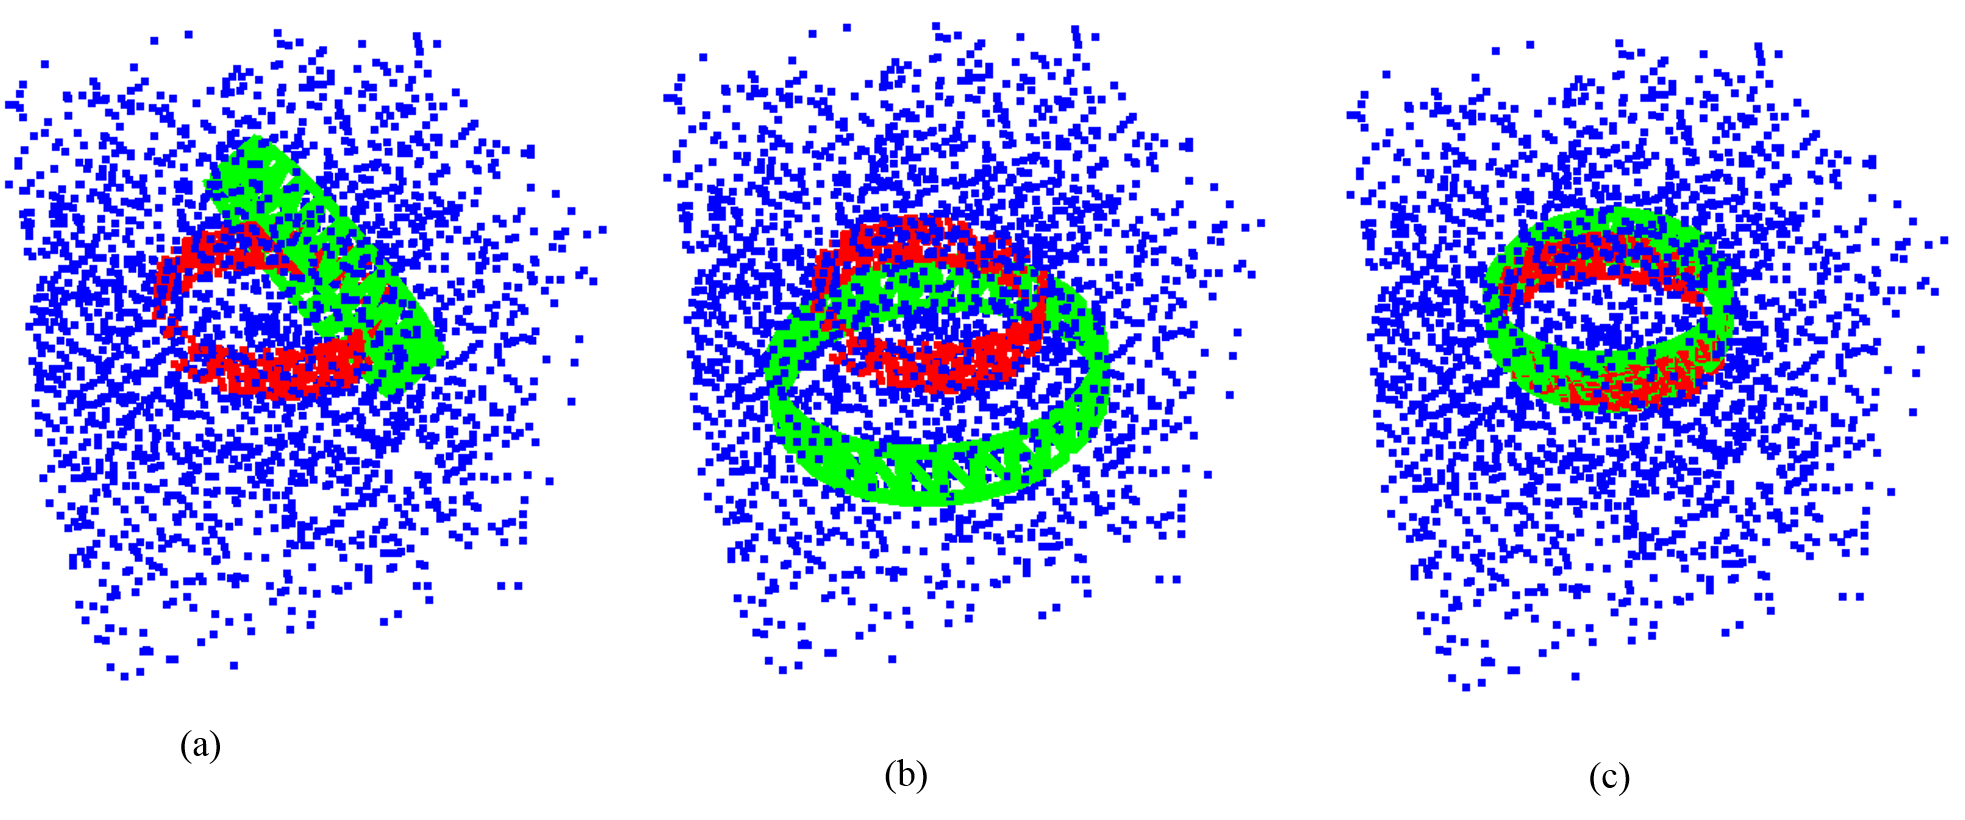
The red points are inliers, whereas blue points are outliers.
DATASET AND CODE FOR FITTING CYLINDER
This data set uses to evaluate the fitting cylinder from point cloud data of cylindrical objects. The format of all data sets is '.pcd' file (file format of point cloud data (pcd)). You can download the data set in this link 'Generated cylinder data set'. This data set consists of six different subsets, denoted from dC1 to dC6. For each subset dCi, inlier ratio is increased by a step of 5% from 10 to 80 % as Table 1. Therefore, there are fifteen point clouds. They are denoted dS1 to dS15. A point cloud dSi consists of three thousand points. Each point of a dSi has the 3-D coordinate (x, y, z) which generated from MATALB based on the cylinder equation. An inlier data point (xi,yi, zi) of dSi is lying on the cylinder's curved-surface which is generated as follows: xi = cos(θi); zi or yi= sin(θi) respectively; yi or zi is randomly selected in [0, 1] respectively; θi is randomly selected from [0, 2π]. That means the cylinder's axis of generating cylinder following the direction of y-axis or z-axis of the original coordiante system. The radius of the generated cylinder is 2, the coordiantes of a point on the cylinder's axis are (0,0,0) and the height of cylinder is 1. Therefore, all of inlier points are generated from a cylinder, that has the equation (x2 + y2 + z2 = 22). Outliers are generated randomly as a normal distribution from [-3, 3] or [-4, 4]. The detail of each subset is presented in Table 1. Some illustrating images of dC1 to dC6 at the inlier ratio 50% (dS5) are presented as Figure 1.
| Dataset | Characteristics of the generalized data | |||
|---|---|---|---|---|
| Height/ Radius |
Direction of main axis |
Spatial distribution of inliers |
Spread of outliers |
|
| dC1, dC4 |
1 / 2 |
parallel withthe z-axis |
Around of a cylinder |
[-3, 3], [-4, 4] |
| dC2, dC5 |
1 / 2 |
parallel with the y-axis |
Around of a cylinder |
[-3, 3], [-4, 4] |
| dC3, dC6 |
1 / 2 |
parallel with the y-axis |
one half of a cylinder |
[-3, 3], [-4, 4] |